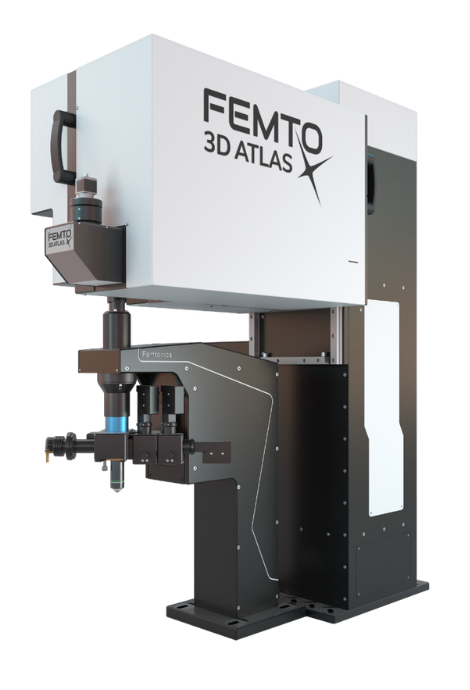
Genetically encoded voltage indicators (ASAP, JEDI2P, etc.) have recently attained a level of quality that renders them valuable tools for studying membrane potentials throughout cells. However, a significant challenge has persisted: the lack of sufficiently fast equipment to capture their dynamics. Until now, there has been a shortage of systems capable of imaging at speeds exceeding kHz, approaching the electrophysiological standard of 10 kHz. The Femtonics 3D AO Atlas addresses this gap by enabling high-speed, three-dimensional voltage imaging. Equipped with the real-time motion correction module, the 3D Real-Time Motion Correction, it achieves rahpid imaging without motion artifacts and ensures high signal-to-noise ratio (SNR) for precise voltage imaging.
Indicators:
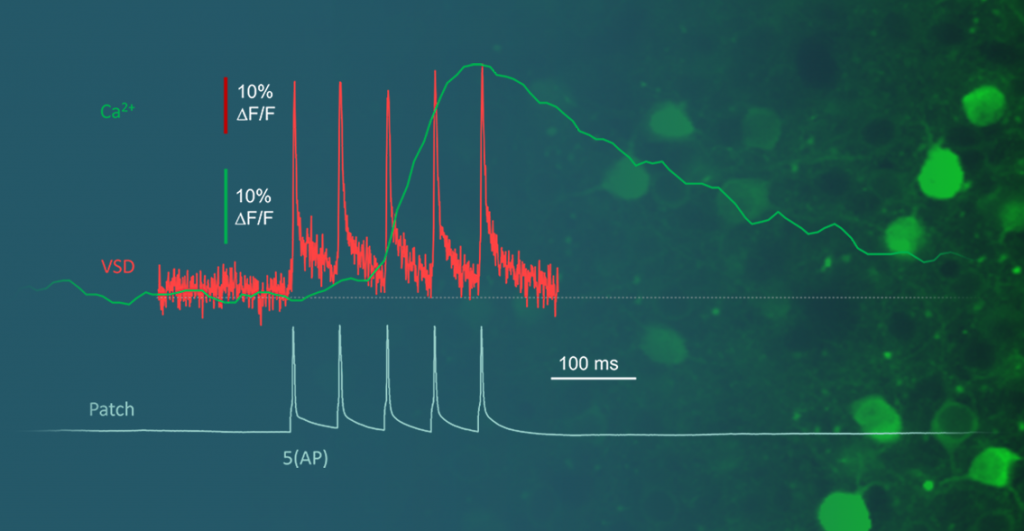
The rapidly evolving voltage sensor technology is going to determine the next decade of neuroscience. Voltage signals have faster kinetics and thus provide and require superior temporal resolution. The sensors report individual action potentials even within fast bursts. Conventional imaging techniques are not fast enough to capture these transients.
Figure 1: Visualizing the speed of the signal and the proof of necessity for Acousto Optical scanning technology. A) Green: Ca2+ from a PV interneuron sampled at 30 Hz Red: JEDI2p sampled at 8.4 kHz. Blue: Patch clamp electrophysiological recording of 5 evoked Action Potentials sampled at 20 kHz. B) Same measurement down–sampled to 80, 40 and 21 Hz.
One of today’s most interesting and challenging task is to measure voltage signals from neurons while the model animal is active. Even recently published in vivo voltage imaging studies have several limiting factors. Femtonics has overcome these limitations and allowed researchers to have higher success rate, higher SNR, higher number of recording locations in 3D, better focus on the dendrites and alternative ways to investigate and interact with neuronal population. All measurement techniques can be easily applied in head-fixed behaving animals too, due to the 3D Real-Time Motion Correction, which enables the high SNR in vivo as well.
Attila Losonczy, MD, PhD – Professor of Neuroscience; Principal Investigator at Columbia’s Zuckerman Institute
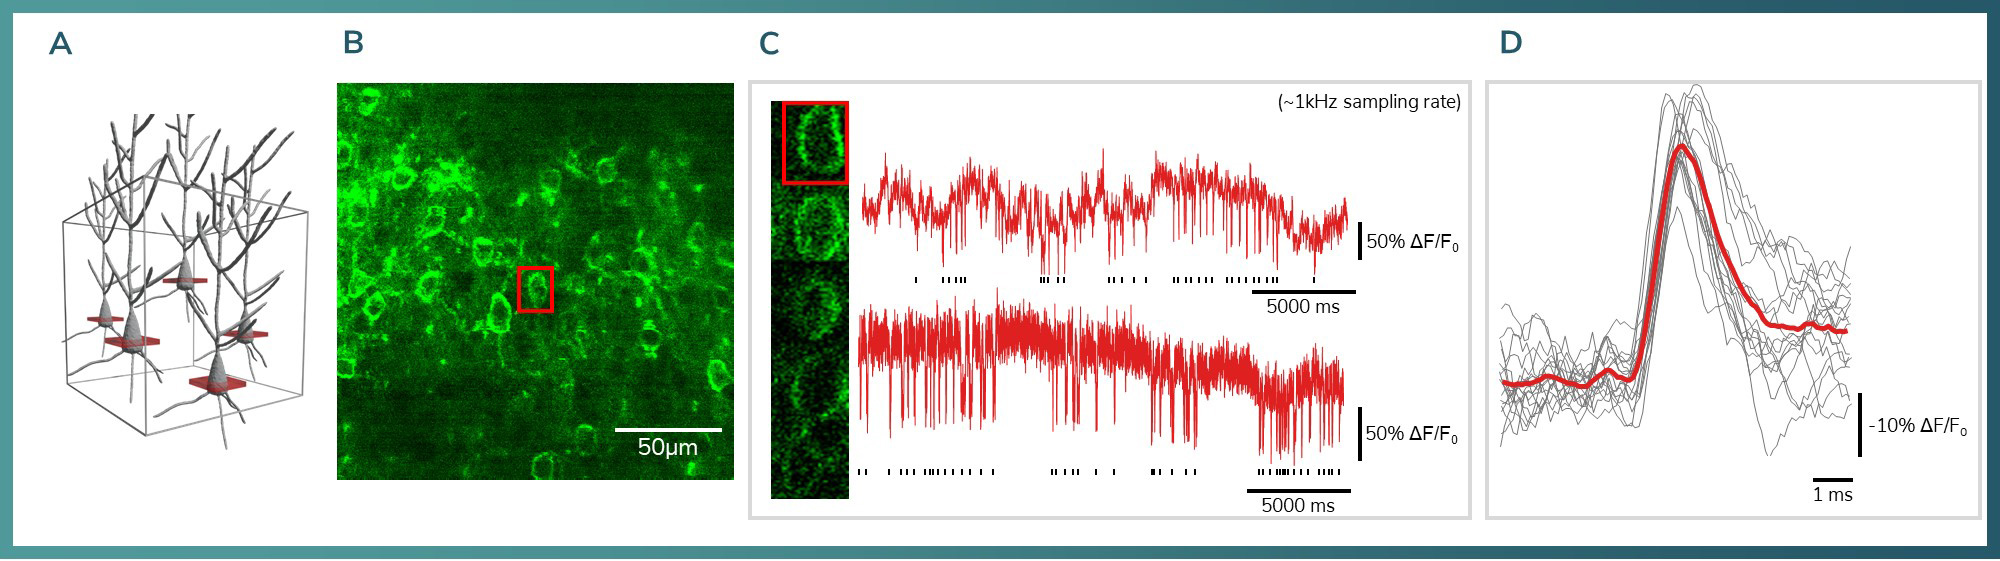
Figure 2: A) 3D model showing the relative locations of the measured neurons. B) Quality JEDI2P labelling in the visual cortex L2/3. C) Example traces showing the SNR with 1 kHz sampling from a behaving animal. Bottom: Chessboard scanning of 5 individual neurons from different Z planes. D) Average of individual APs. (n=17)
Increased number of somatic recordings
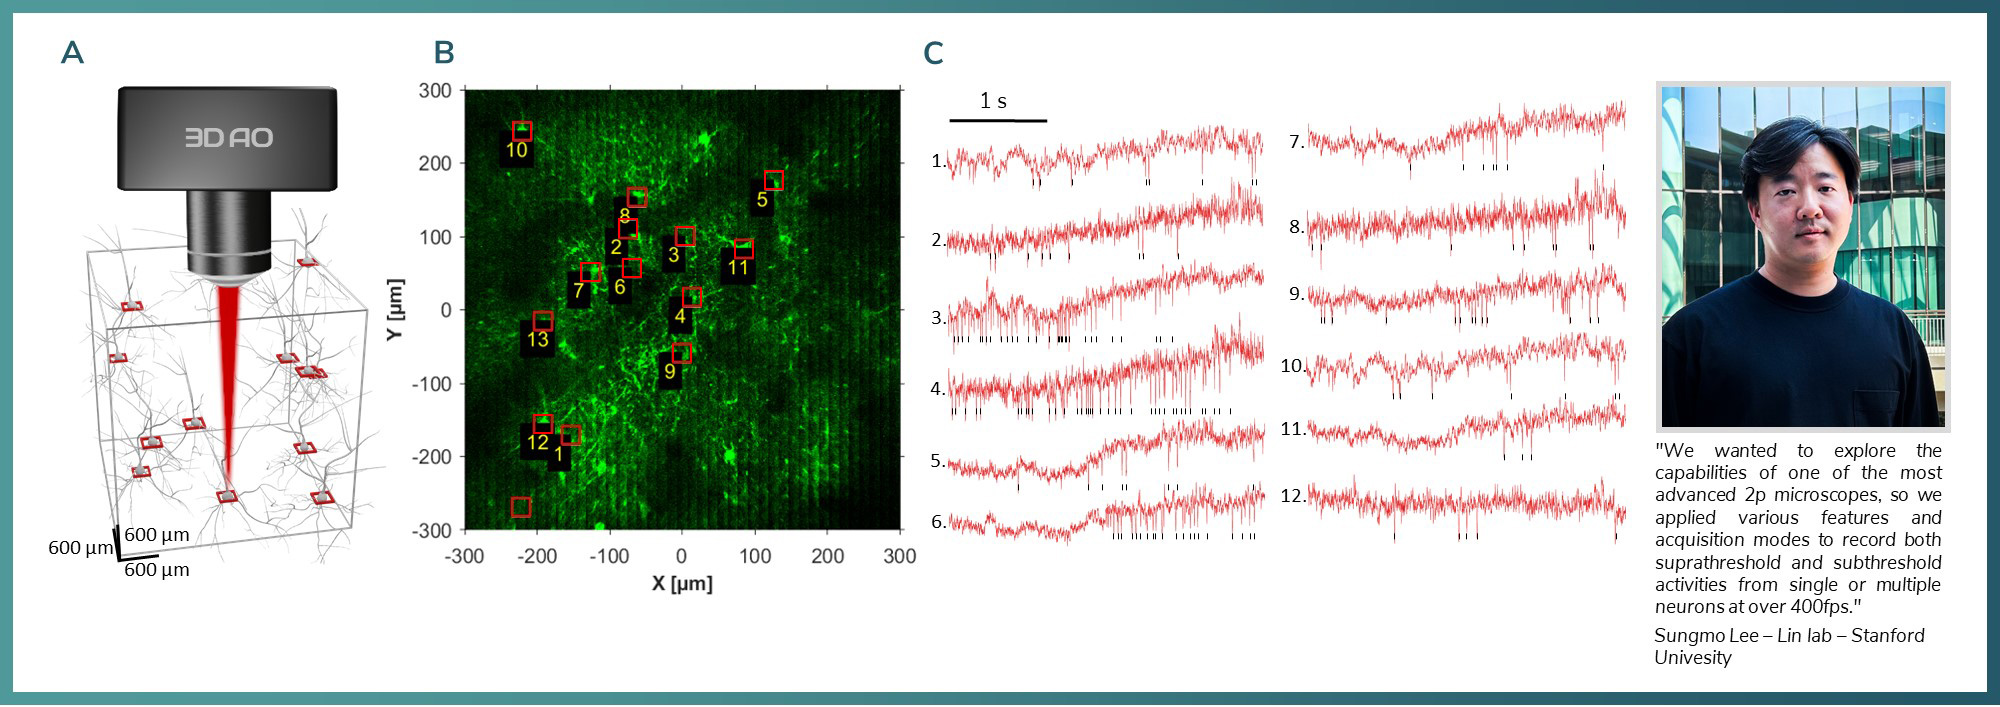
Figure 3: A) Chessboard ROIs in 600 x 600 x 600 um volume B) ASAP labelling in the in M1 region, red squares mark the recorded areas with low resolution. C) Voltage traces from 13 neurons in head-fixed conditions recorded with 400 Hz speed.
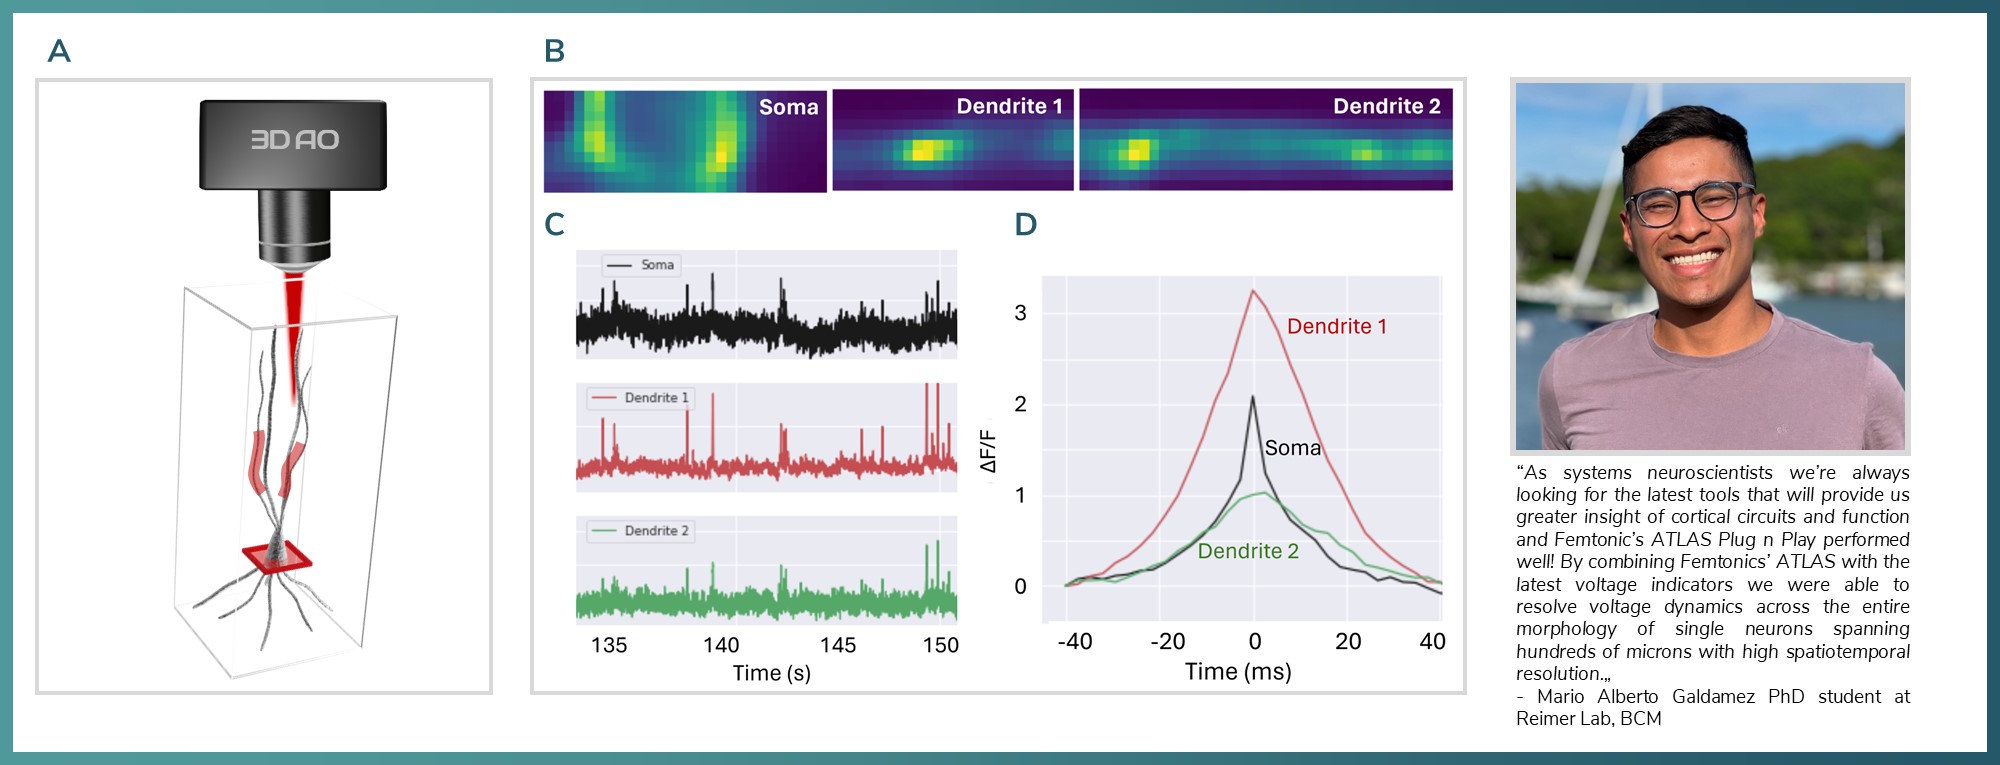
Dendritic voltage imaging
Figure 4: A) 3D model showing a chessboard and ribbon scans from the same neuron in visual cortex B) Recorded ROIs from different planes. C) Voltage traces the recorded areas D) Soma and the two different dendritic segment aligned.
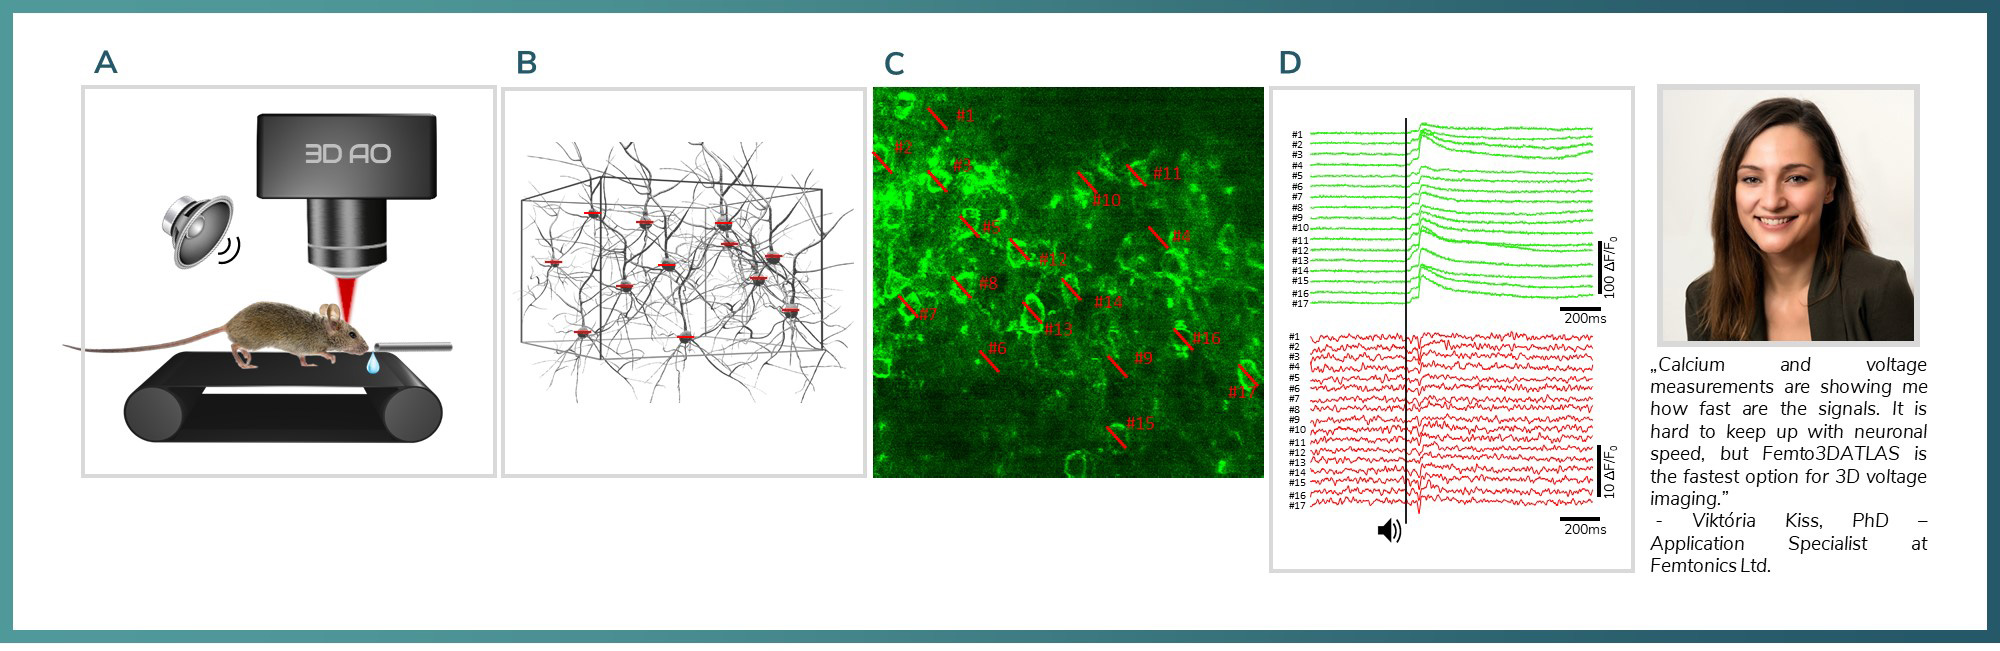
Simultaneous Ca and Voltage imaging measurements
Figure 5: A) Experimental setup: mice were active on a treadmill while undergoing two-photon voltage imaging with Femto3DATLAS. Auditory stimulus served as activation signal in the V1 cortex. B) 3D model of the network which was recorded with line scans. C) JEDI2P labelled neurons in the field of view. Red lines mark the location of the line scans with 2.2kHz D) Averaged signal responses for the auditory stimulus from 17 neurons. Green: jRGECO calcium signals, Red: JEDI2P voltage signals excited on 1040nm. The black line shows the timing of the auditory stimulus.
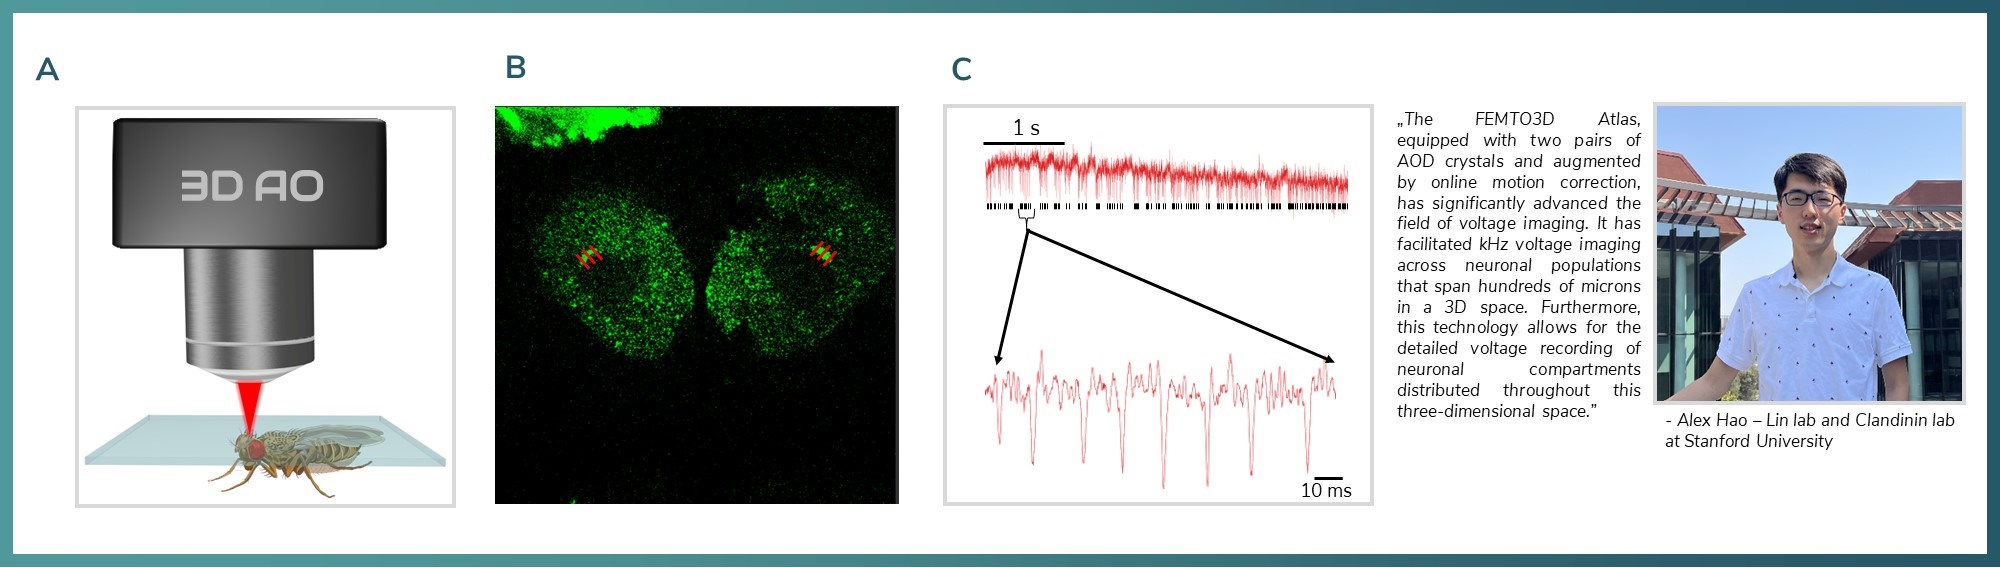
Optical electrophysiology in drosophila
Figure 6: A) Schematics of Drosophila 2p imaging. B) ASAP labelled Drosophila neurons. Red lines over the somata are representing the line scan locations C) ASAP signal from the labelled neuron recorded with 6675.57 Hz.
We offer optical electrophysiology solutions for problems that are impossible or close to impossible to solve with classical electrophysiology (i.e. multiple site dendritic patch, repeated bouton patch etc.) working today in the patch clamping world of electrophysiology and photoactivation, as multiple measurements sites can be recorded with up to 100 kHz by applying the DRIFT scanning in 3D. (Szalay et al. 2016)
Dr. Christopher D. Makinson – Assistant Professor of Neurological Sciences (in Neurology, and the Institute of Genomic Medicine Columbia University).
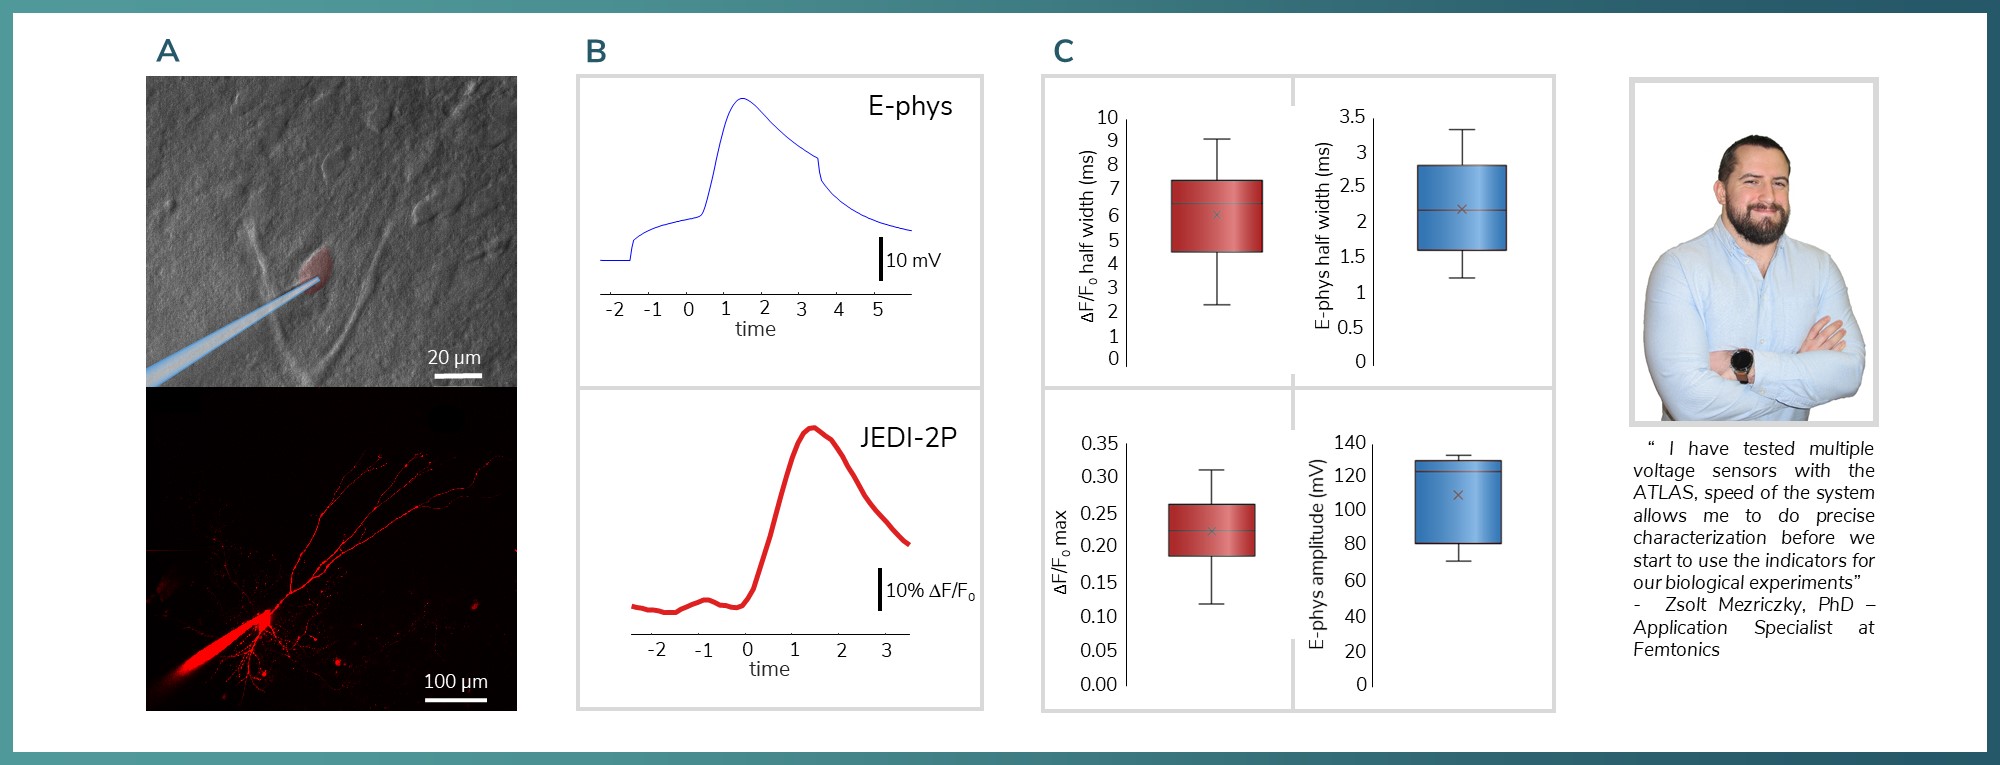
Optical validation of voltage sensor
Figure 7: Validation of concept comparison of acousto-voltage imaging and electrophysiology measurements. A) Whole cell patch–clamp camera image and the maximum intensity projection of the patched neuron under two–photon microscopy B) Rise time comparison of the JEDI2P and the electrophysiological signal C) Half-width on the top and signal amplitude measurement comparisons on the bottom.
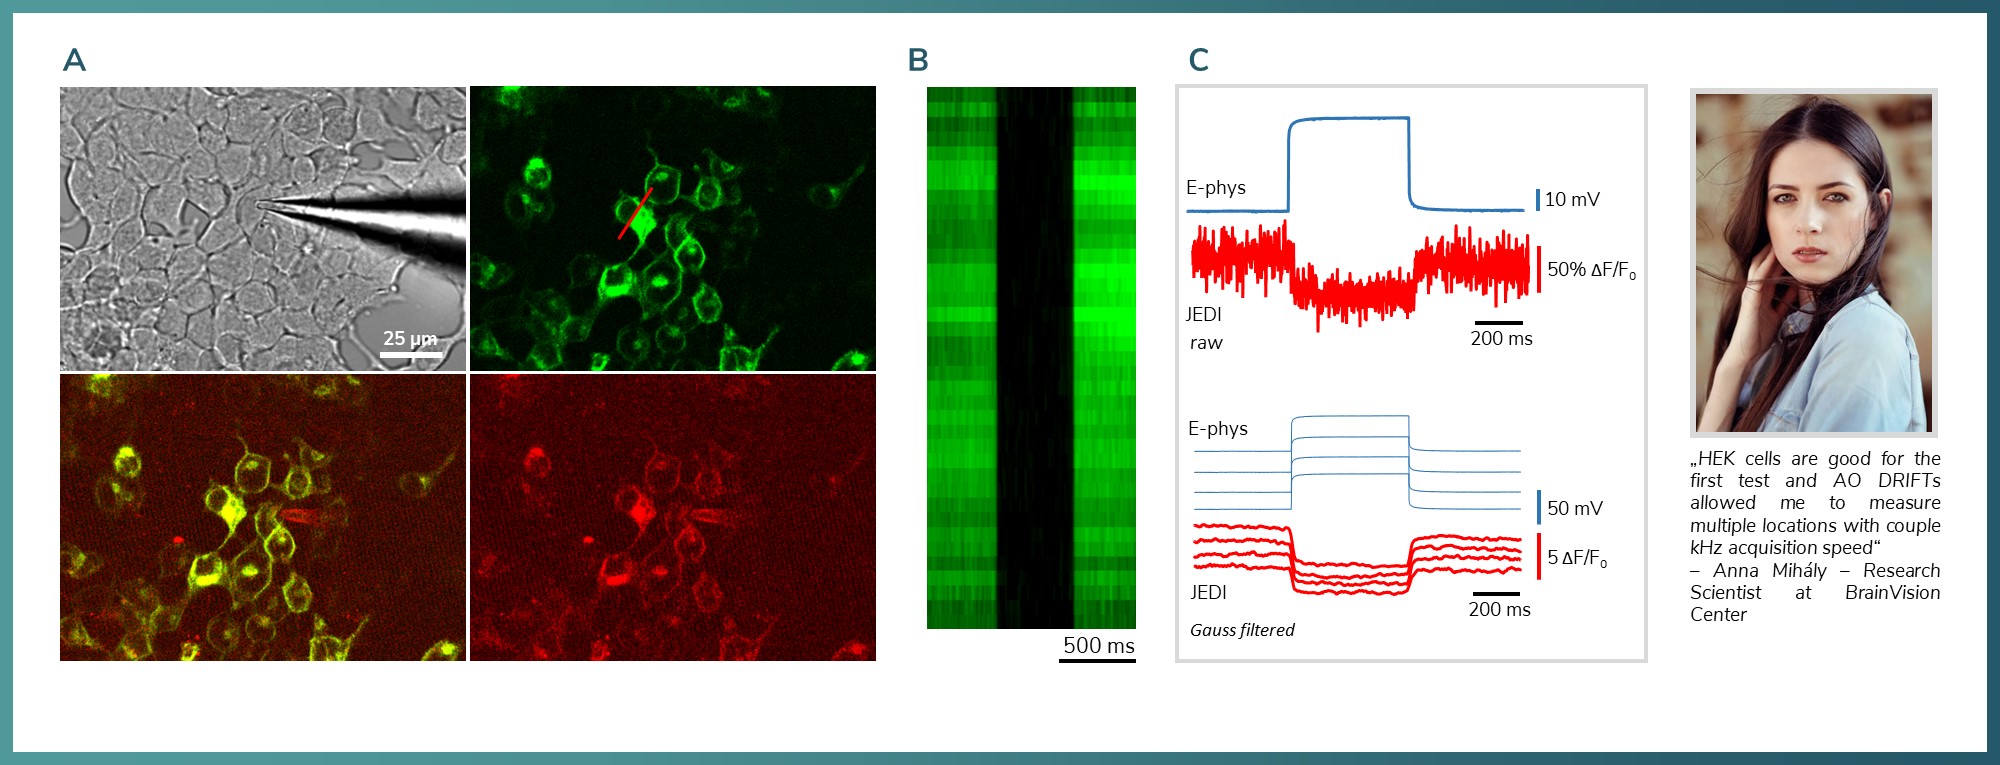
Optical somatic electrophysiology of cell cultures, organoids, brain slices
Figure 8: Combined two-photon and electrophysiology of HEK 293 cells. A) Camera image and fluorescent labelling of the field-of-interest. JEDI2P in the green channel. The measurements were done along the line marked with red. B) Fluorescent intensity change during ramp test on a HEK cell. The intensity decreased under the detection threshold C) Top is raw data, bottom is filtered. Somatically evoked ramp test. Blue: electrophysiology, red is voltage signals measured with 8.32 kHz.
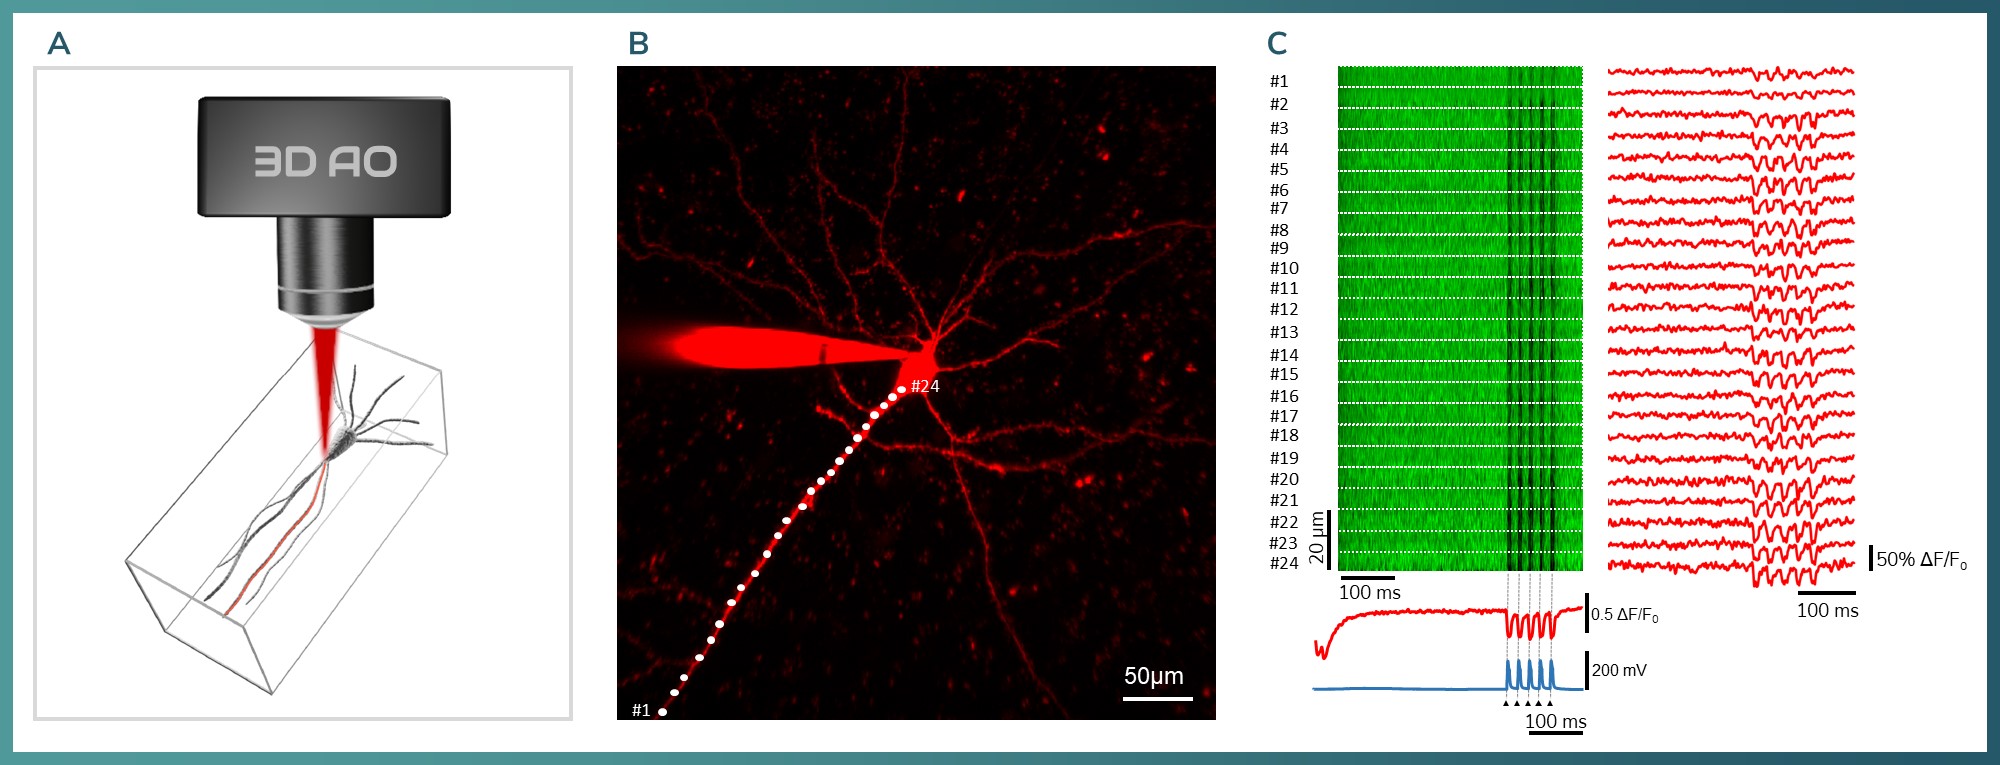
3D Optical electrophysiology from dendrites and spines
Figure 9: A) 3D model of a single pyramidal neuron measured in vitro with 3D line scan. The red mark is showing the recorded region with a 3D line scan. B) Maximum intensity Z projection of a cortical pyramidal cell. White dots are indicating the measurement locations. C) Somatically evoked 5 backpropagating action potentials. Left: Fluorescent intensity map of JEDI2P from pyramidal cell’s apical dendrite. Right: Temporal integration of the intensity map at the given ROI. There were 24 ROIs from the measured dendritic area with 2.24 kHz. Bottom: Arrows indicating the somatically evoked events, blue: electrophysiology, red: integrated curves for the whole dendrite based on the JEDI2P signal.
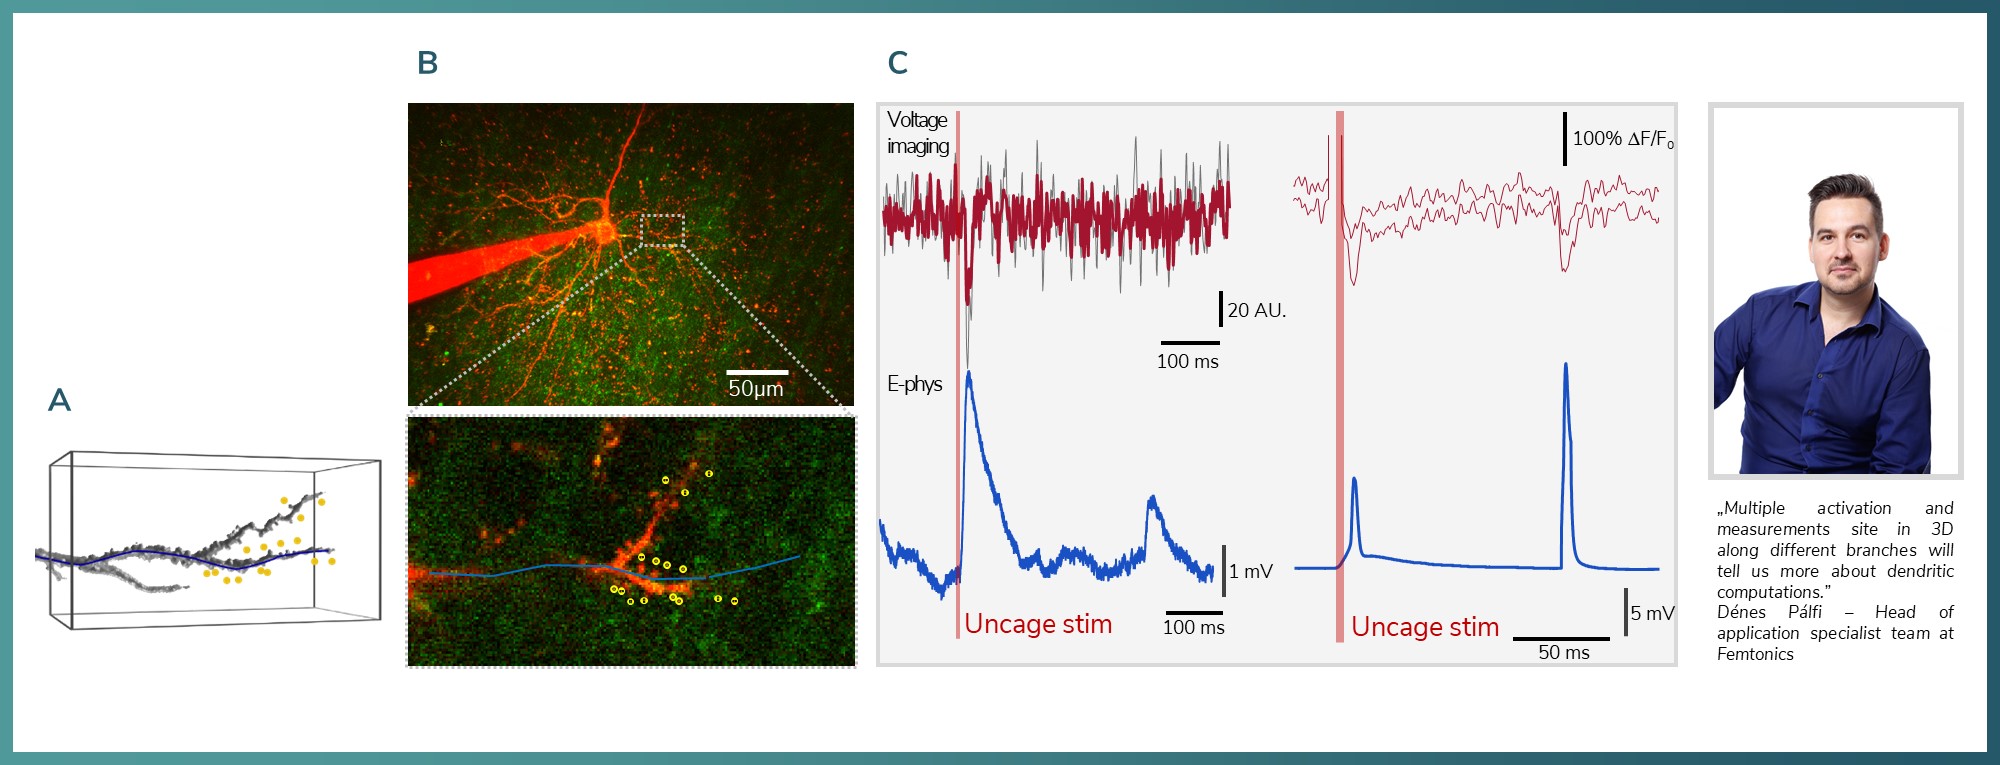
Optical electrophysiology combined with uncaging
Figure 10: A) 3D reconstruction of a dendrite with the uncaging locations marked with yellow. The imaging as 3D line scan marked with blue B) Maximum Z-projection of a pyramidal neuron (ALEXA-594) and in the inset the scanning line (blue), uncaging locations (yellow, 15 locations, 0.3 ms ROI time). C) Examples of uncaging (DNI-Glu) evoked EPSP (top, JEDI-2P signal on dendrite, bottom somatically recorded electrophysiological signal).
Coming soon:
Photostimulation and voltage imaging
Reference labs are located at: Stanford University , Baylor College of Medicine, Columbia University, Basel University, NIH and BrainVisionCenter.
We are eager to demonstrate you our capabilities online in vitro or in vivo. Book an appointment to see how easy to achieve such results.
More developments are in the works that focus on voltage imaging such as disc scanning, 3-level image stabilization, immediate multi-channel analysis, etc.
Our partners have an extremely high grant success rate with voltage imaging. We are ready to help you and work with you on your grant applications: CONNECT to you sales representative for grant application assistance!